Image Details
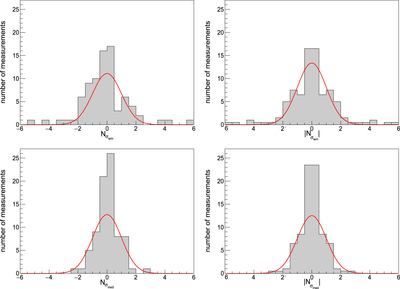
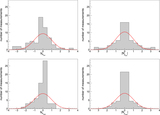
Caption: Figure 4.
Histograms of the error distribution in half standard deviation bins for Cepheids. The top (bottom) row uses the weighted mean (median) of the 81 measurements as the central estimate. The left column shows the signed deviation, where positive (negative) Nσ represent a value that is greater (less) than the central estimate. The right column shows the absolute symmetrized distributions. The smooth curve in each panel is the best-fit Gaussian.
Other Images in This Article
Copyright and Terms & Conditions
© 2015. The American Astronomical Society. All rights reserved.
Copyright ©
2025 Astronomy Image Explorer. All Rights Reserved.