Image Details
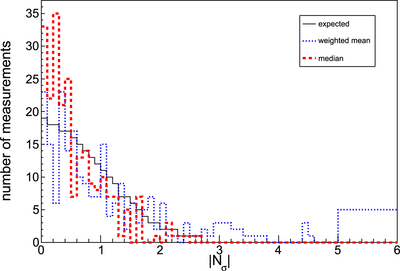
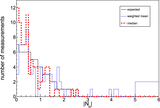
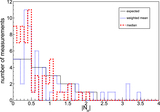
Caption: Figure 2.
Histogram of the error distributions in ﹩| {N}_{\sigma }| =0.1﹩ bins (with the exception of the last, truncated, bin with ﹩5\leqslant | {N}_{\sigma }| \leqslant 6﹩ that contains the number of measurements to ﹩| {N}_{\sigma }| =8﹩). The solid black line represents the expected Gaussian probabilities for 232 measurements and the dotted blue (dashed red) line is the number of ﹩| {N}_{\sigma }| ﹩ values in each bin for the weighted mean (median) case.
Other Images in This Article
Copyright and Terms & Conditions
© 2015. The American Astronomical Society. All rights reserved.
Copyright ©
2025 Astronomy Image Explorer. All Rights Reserved.