Image Details
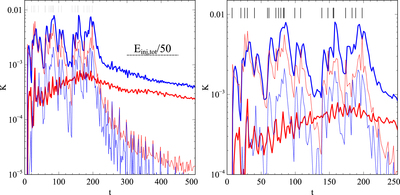
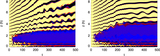
Caption: Figure 6.
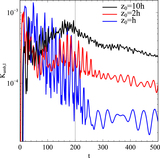
Decomposition of the volume-integrated kinetic energy into compressible/incompressible modes (dotted/solid lines respectively) and bubble-debris/ambient regions (blue/red lines respectively). The right panel is a zoom in on the early phase of the evolution. The short vertical black lines at the top of both panels show the times of the individual AGN injection events (23 events in total). Time is measured in units of ﹩h/{c}_{{\rm{iso,0}}}﹩ and kinetic energies are in units of ﹩{\rho }_{0}{c}_{{\rm{iso,0}}}^{2}{h}^{3}.﹩
Other Images in This Article
Copyright and Terms & Conditions
© 2015. The American Astronomical Society. All rights reserved.
Copyright ©
2025 Astronomy Image Explorer. All Rights Reserved.