Image Details
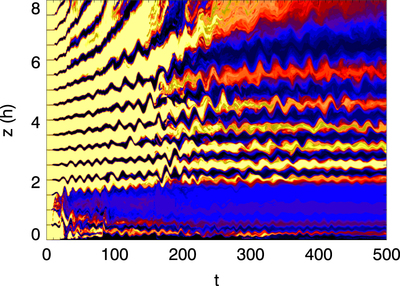
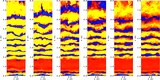
Caption: Figure 3.
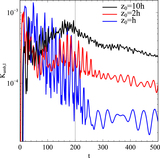
Spacetime plot of a “core sample” (﹩x=y=0,z\in [0,8h]﹩) of the tracer ﹩{\mu }_{2}.﹩ This provides a quasi-Lagrangian view of the dynamics. We use a logarithmic color table spanning the range ﹩{\mu }_{2}={10}^{-4}﹩ (light yellow) to ﹩{\mu }_{2}=1﹩ (black). Time is measured in units of ﹩h/{c}_{{\rm{iso,0}}}.﹩
Other Images in This Article
Copyright and Terms & Conditions
© 2015. The American Astronomical Society. All rights reserved.
Copyright ©
2025 Astronomy Image Explorer. All Rights Reserved.