Image Details
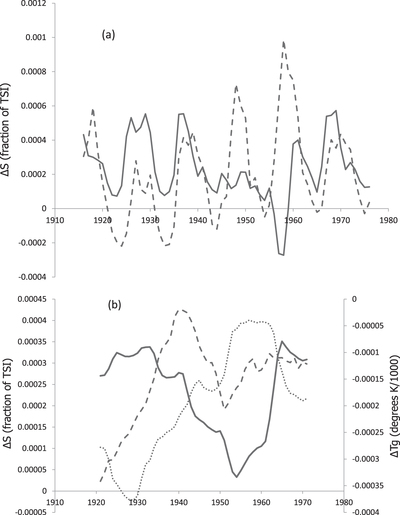
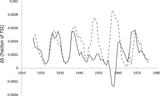
Caption: Figure 4.
(a) Comparison of ΔS from Af solid) and the NRL TSI time series (dashed); (b) 11-year smoothed ΔS from Af (solid), NRL (dotted) compared to the global temperature variation, Tg (dashed).
Other Images in This Article
Copyright and Terms & Conditions
© 2015. The American Astronomical Society. All rights reserved.
Copyright ©
2025 Astronomy Image Explorer. All Rights Reserved.