Image Details
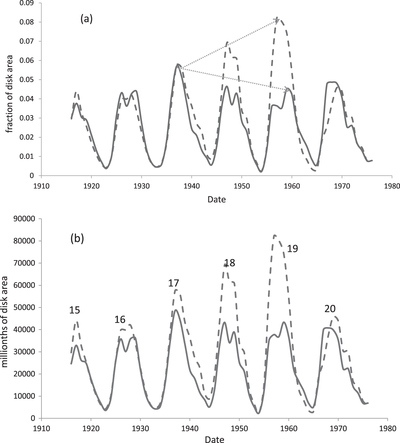
Caption: Figure 2.
(a) The annual mean Af (solid) and Apn for sunspot cycles 15–20. Af has been multiplied by 20. The arrows show the trends of peak Apn and Af. Panel (b) shows the observed (dashed) and calculated (solid) Apn from relation (1).
Other Images in This Article
Copyright and Terms & Conditions
© 2015. The American Astronomical Society. All rights reserved.
Copyright ©
2025 Astronomy Image Explorer. All Rights Reserved.