Image Details

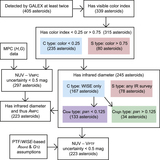
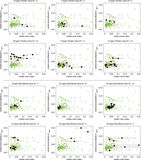
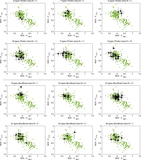
Caption: Figure 6.
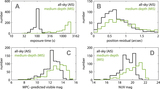
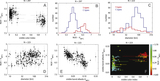
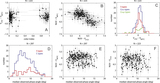
Distribution of the NUV − V color for GALEX-observed asteroids using the D,Abond,G12 model with PTF data, infrared data, and color data to to predict V. See Table 2 for the definitions of the S, Clow, and Chigh groups in plots (B), (C), (E), and (F).
Other Images in This Article
Copyright and Terms & Conditions
© 2015. The American Astronomical Society. All rights reserved.
Copyright ©
2025 Astronomy Image Explorer. All Rights Reserved.