Image Details
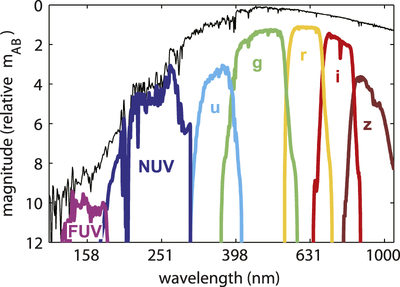
Caption: Figure 1.
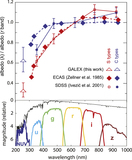
GALEX UV and SDSS visible filter response curves (colored lines) multiplied by the spectrum of a G2 V type star (black line). The spectrum is from the library of Pickles (1998). The vertical scale is in AB magnitude units per unit wavelength, offset by an arbitrary constant. Note wavelength is plotted on a log scale.
Other Images in This Article
Copyright and Terms & Conditions
© 2015. The American Astronomical Society. All rights reserved.
Copyright ©
2025 Astronomy Image Explorer. All Rights Reserved.