Image Details
Caption: Figure 5.
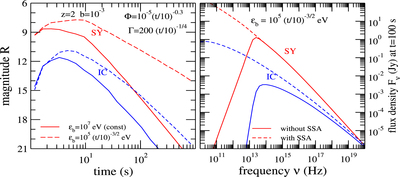
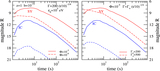
Left panel: optical light curves from pairs formed in the shocked fluid, for the indicated parameters, and for the wind-like external medium given in Equation (35). Solid lines are for a constant break-energy ﹩{{\varepsilon }_{b}}﹩ of the high-energy emission that forms pairs. The synchrotron flux (red line) exhibits a decay that is slightly steeper than estimated from Equation (87), while the inverse-Compton flux (blue line) has a decay that is significantly slower. Dashed lines are for a decreasing ﹩{{\varepsilon }_{b}}﹩, which yields a slower flux decay. Right panel: synchrotron and inverse-Compton spectra at t = 100 s, for a decreasing ﹩{{\varepsilon }_{b}}﹩. Dotted lines show spectra without accounting for synchrotron self-absorption (SSA), solid lines are for absorbed spectra. Owing to the large magnetic field parameter b, the Compton parameter is below unity and the inverse-Compton emission is dimmer than synchrotron at all frequencies of interest. The synchrotron cooling break is slightly below the optical.
Other Images in This Article
Copyright and Terms & Conditions
© 2015. The American Astronomical Society. All rights reserved.