Image Details
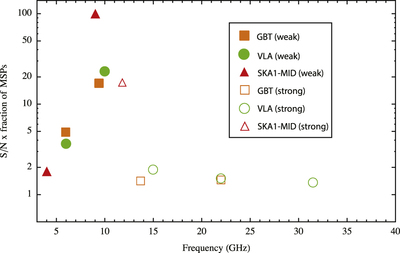
Caption: Figure 3.
An estimate of the optimal detection frequency for MSPs with spin periods up to 50 ms, under the assumption that the MSP period distribution at the GC is the same as that of the known MSP population. For each frequency band, the plot shows the fraction of pulsars with spin periods whose peak S/N falls in this band, weighted by their peak detection S/N. The filled symbols designate values for the weak scattering case, while open symbols indicate the corresponding values for the strong scattering case.
Other Images in This Article
Copyright and Terms & Conditions
© 2015. The American Astronomical Society. All rights reserved.
Copyright ©
2025 Astronomy Image Explorer. All Rights Reserved.