Image Details
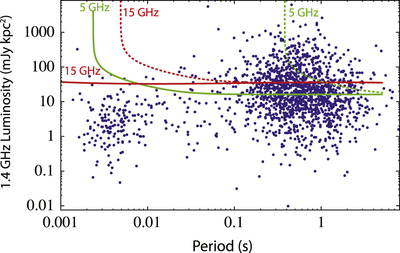
Caption: Figure 1.
The 1.4 GHz luminosity (in mJy kpc2) of the known pulsar population (Manchester et al. 2005) is plotted vs. pulsar period. The 10σ sensitivities of previous 5 GHz (Johnston et al. 2006) and 15 GHz GBT (Macquart et al. 2010) searches of the Galactic Center are shown by the green and red curves, respectively, with the dashed and solid curves representing the “strong” and “weak” temporal smearing scenarios, respectively.
Other Images in This Article
Copyright and Terms & Conditions
© 2015. The American Astronomical Society. All rights reserved.
Copyright ©
2025 Astronomy Image Explorer. All Rights Reserved.