Image Details
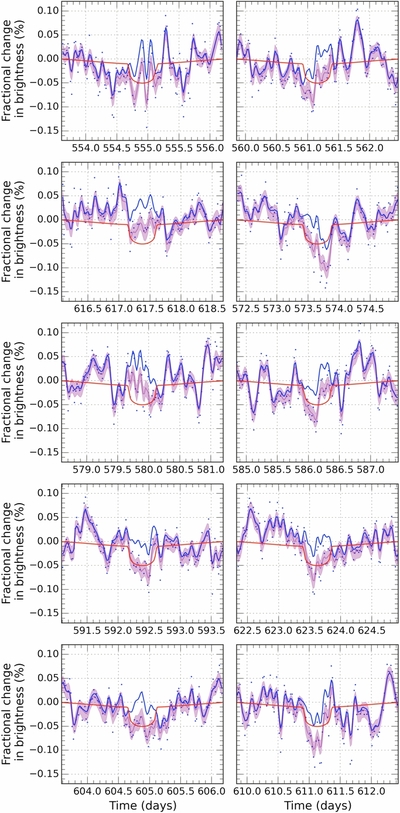
Caption: Figure 3.
Ten transits are shown to demonstrate our noise model. The observed data is shown as black points, the mean noise model in blue, and the mean light curve model in red. The combined light curve and noise model is shown as the shaded purple region where the shaded region shows the 1σ bounds of the model. The shaded region does not include the white noise component but does include the uncertainty in both the noise model and the transit model. For each transit we show 2.4 days of data, while the y-scale is 0.29%.
Other Images in This Article
Show More
Copyright and Terms & Conditions
© 2015. The American Astronomical Society. All rights reserved.
Copyright ©
2026 Astronomy Image Explorer. All Rights Reserved.