Image Details
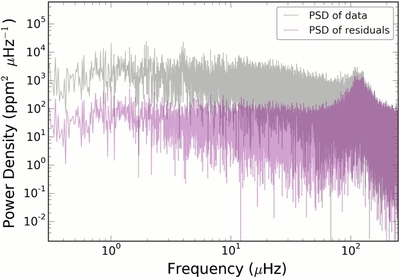
Caption: Figure 7.
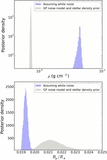
Power spectral density of the light curve of Kepler-91 is shown in gray while the same light curve with our mean noise model and best fitting transiting planet model subtracted off is shown in purple. The low frequency power is reduced by an order of magnitude by using our noise model. The peak around 100 μHz is owing to the red giant oscillations which we make no attempt to remove.
Other Images in This Article
Show More
Copyright and Terms & Conditions
© 2015. The American Astronomical Society. All rights reserved.
Copyright ©
2024 Astronomy Image Explorer. All Rights Reserved.