Image Details
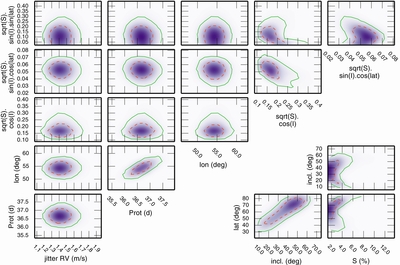
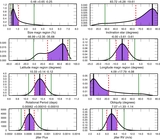
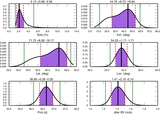
Caption: Figure 6.
Correlation between the different posterior distributions obtained from the MCMC fit to the data of α Cen B. The 1σ and 2σ contours are shown with dashed red and continuous green lines, respectively.
Other Images in This Article
Copyright and Terms & Conditions
© 2014. The American Astronomical Society. All rights reserved.
Copyright ©
2026 Astronomy Image Explorer. All Rights Reserved.