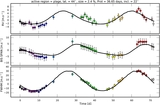
Image Details
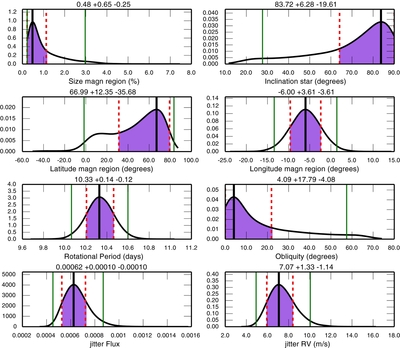
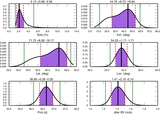
Caption: Figure 4.
Marginalized posterior distributions returned by our MCMC fit to the data of HD 189733. The mode (black thick line) of the distribution for each parameter, with its 1σ uncertainty (purple shaded regions delimited by red dashed lines) and 2σ uncertainty (delimited by green thin lines), can be found on each plot. The title of each plot gives the value for the mode of the distribution and its 1σ uncertainty.
Other Images in This Article

Copyright and Terms & Conditions
© 2014. The American Astronomical Society. All rights reserved.
Copyright ©
2026 Astronomy Image Explorer. All Rights Reserved.