

Image Details
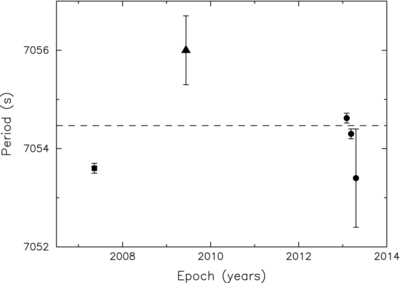
Caption: Figure 4.
Period variations of flares from TVLM 513. The filled square, triangle, and circles represent period measurements based on the data from Hallinan et al. (2009), Doyle et al. (2010), and the Arecibo measurements discussed in this paper, respectively. The horizontal, dashed line marks the best-fit period derived from the timing model of the entire set of arrival time measurements made between 2006 and 2013.
Other Images in This Article


Copyright and Terms & Conditions
© 2014. The American Astronomical Society. All rights reserved.

Copyright ©
2026 Astronomy Image Explorer. All Rights Reserved.
