

Image Details
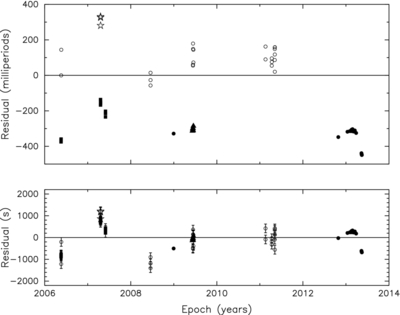
Caption: Figure 2.
Post-fit residuals from the modeling of TVLM 513 radio flare and optical brightness peak arrival times. Top: a fit for phase only with the period fixed at 7054.49 s (Harding et al. 2013). Bottom: a fit for phase, period, and the offset between the radio and the optical data. The open circles and stars denote the optical data taken from Harding et al. (2013) and Berger et al. (2008), respectively. The filled squares and triangles are for the respective radio measurements by Hallinan et al. (2006), Hallinan et al. (2009), and Doyle et al. (2010). The filled circles mark the radio flare arrival times derived from the Arecibo observations described in this paper.
Other Images in This Article


Copyright and Terms & Conditions
© 2014. The American Astronomical Society. All rights reserved.

