Image Details
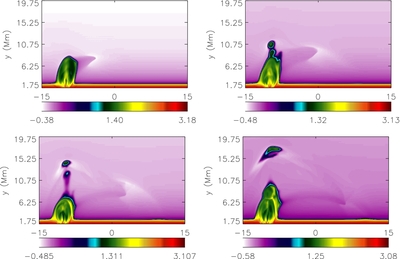
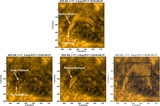
Caption: Figure 6.
Mass density maps in X–Y plane (for z = 0) at times t = 50 s, t = 75 s, t = 100 s, and t = 125 s. The evolution of shock front along the flux-rope field lines and the complex plasma motions are evident.
Other Images in This Article
Copyright and Terms & Conditions
© 2014. The American Astronomical Society. All rights reserved.
Copyright ©
2025 Astronomy Image Explorer. All Rights Reserved.