Image Details
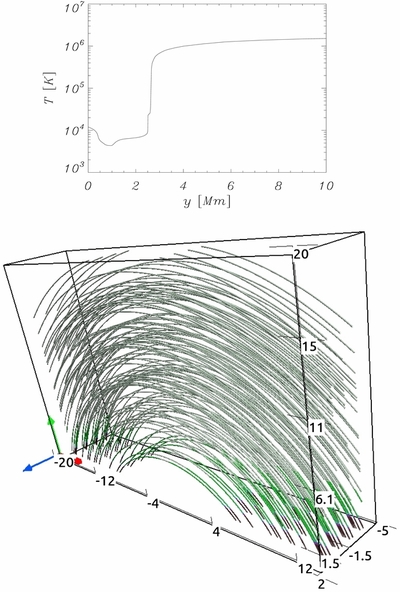
Caption: Figure 1.
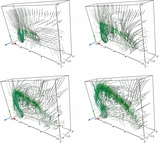
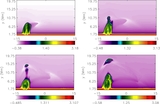
Equilibrium profiles of temperature (top panel) and magnetic field lines (bottom panel). The 3D visualization of the simulation data is carried out using the VAPOR (Visualization and Analysis Platform) software package.
Other Images in This Article
Copyright and Terms & Conditions
© 2014. The American Astronomical Society. All rights reserved.
Copyright ©
2025 Astronomy Image Explorer. All Rights Reserved.