Image Details
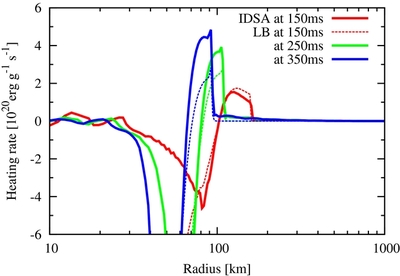
Caption: Figure 24.
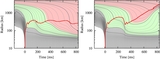
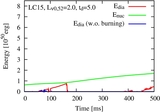
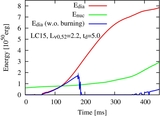
Radial distribution of heating rates for 1D model at t pb = 150 (red lines), 250 (green lines), and 350 ms (blue lines). LB models (thin lines) tend to overestimate the heating rate in a pre-shock region and underestimate in a post-shock region.
Other Images in This Article
Show More
Copyright and Terms & Conditions
© 2014. The American Astronomical Society. All rights reserved.
Copyright ©
2025 Astronomy Image Explorer. All Rights Reserved.