Image Details
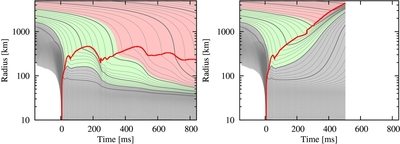
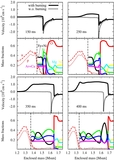
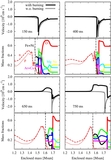
Caption: Figure 3.
Evolution of model LC15 with a parameter set of ( L ν0, 52, t d ) = (2.2, 2.0) visualized by the mass-shell trajectories. The thick red line starting at t = 0 denotes the position of the shock. Both cases, either without (left) or with (right) the energy feedback from nuclear reactions, are shown. The regions colored by gray, green, and red correspond to the iron, silicon, and oxygen layers, respectively. Thick gray lines correspond to the mass coordinates from 1.3 to 1.8 M ☉ with every 0.1 M ☉ (thin gray lines with every 0.02 M ☉).
Other Images in This Article
Show More
Copyright and Terms & Conditions
© 2014. The American Astronomical Society. All rights reserved.
Copyright ©
2025 Astronomy Image Explorer. All Rights Reserved.