Image Details
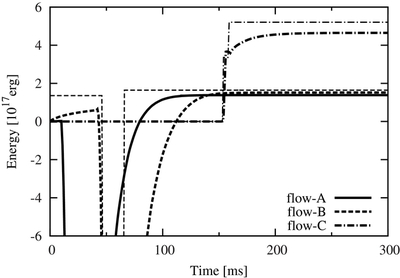
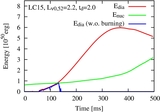
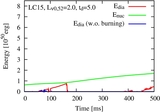
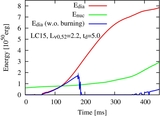
Caption: Figure 21.
Temporal summations of released energy through nuclear reactions. Results from the network calculation (thick lines) and pseudo-flashing method (thin lines) are shown for three flows. The solid thin line (flow-A calculated with the pseudo-flashing method) presents almost the same evolution as the network case and is hidden by the solid thick line.
Other Images in This Article
Show More
Copyright and Terms & Conditions
© 2014. The American Astronomical Society. All rights reserved.
Copyright ©
2025 Astronomy Image Explorer. All Rights Reserved.