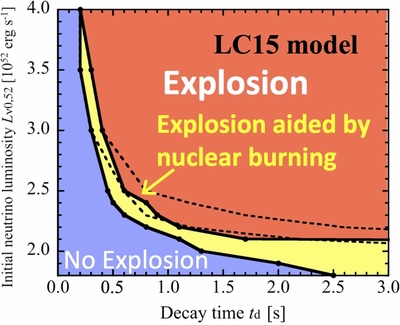
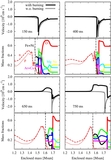
Same as Figure
10 but for 2D simulations. The dashed lines represent the critical curves in 1D (compare Figure
10). Note that we adopt coarse mesh points in the polar direction (32 uniform grids), so that we can perform 2D simulations
for 174 models in total to make this parameter map.