Image Details
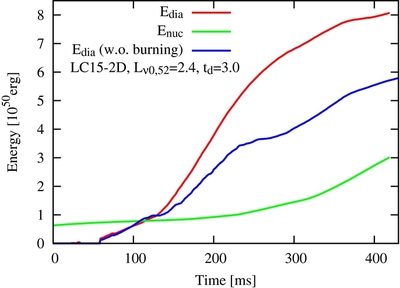
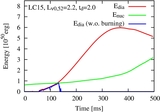
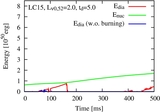
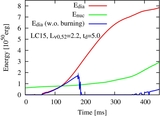
Caption: Figure 16.
Time evolution of the diagnostic energy (red line) and net nuclear burning energy (green) for LC15 model in 2D ( n θ = 32) with ( L ν0, 52, t d ) = (2.4, 3.0). The diagnostic energy of the case without nuclear burning (blue) is also shown.
Other Images in This Article
Show More
Copyright and Terms & Conditions
© 2014. The American Astronomical Society. All rights reserved.
Copyright ©
2025 Astronomy Image Explorer. All Rights Reserved.