Image Details
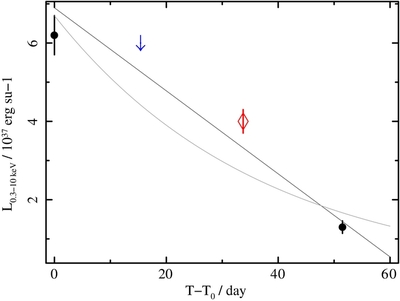
Caption: Figure 4.
0.3–10 keV luminosity lightcurve for T13; C1 and C2 are represented by circles, and X1 is represented by a diamond. A downward arrow represents the observation of H2. We present the best fit linear and exponential fits. Time is quoted relative to C1.
Other Images in This Article
Copyright and Terms & Conditions
© 2014. The American Astronomical Society. All rights reserved.
Copyright ©
2025 Astronomy Image Explorer. All Rights Reserved.