Image Details

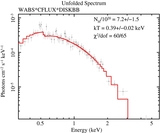
Caption: Figure 3.
~0.3–5 keV XMM-Newton pn spectrum of T3 fitted with the double thermal (disk blackbody + blackbody) emission model. The disk blackbody and blackbody components are represented by dashed and dotted lines, respectively; the solid line represents the combined emission.
Other Images in This Article
Copyright and Terms & Conditions
© 2014. The American Astronomical Society. All rights reserved.
Copyright ©
2025 Astronomy Image Explorer. All Rights Reserved.