Image Details
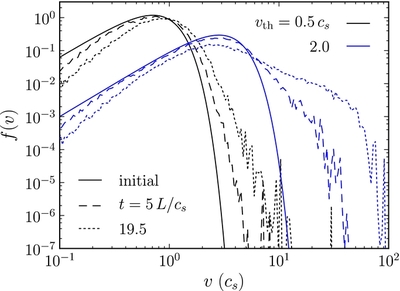
Caption: Figure 9.
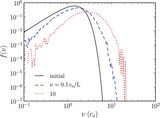
Initially Maxwellian distributions of test particles with v th = 0.5 and 2 c s are simulated for t = 20 L/ c s (many eddy turnover times), with a high scattering rate ν = 10 3 c s / L. We show the initial (solid) and final (dotted) distributions, as well as at an intermediate time (dashed). Power-law tails develop in the velocity regime with the enhanced D∝ v 4 velocity diffusion in Figure 4. There is not, however, a "universal" power-law slope to the resulting distribution function. Instead, the slope depends on time, thermal velocity of the distribution, and pitch-angle scattering rate (the latter dependence is not explicitly shown here). f( v) shown here is the one-dimensional distribution function, normalized such that the density is n 0 = ∫ dvf( v).
Other Images in This Article

Copyright and Terms & Conditions
© 2013. The American Astronomical Society. All rights reserved.