Image Details
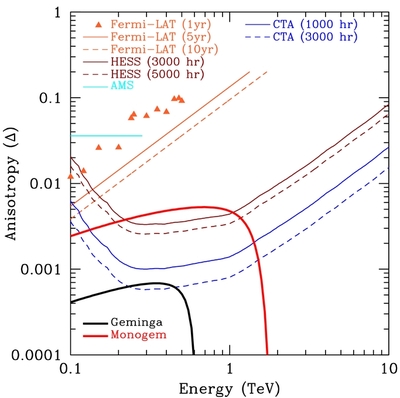
Caption: Figure 2.
The limits on the cosmic-ray e ± anisotropy 1 yr of Fermi-LAT data (orange triangles) and those recently reported by AMS (cyan), as well as the predicted limits from 5 and 10 yr of Fermi-LAT observations (orange solid and orange dashed), along with the predicted limits from 3000 and 5000 hr of H.E.S.S. observations (maroon solid and maroon dashed), as well as predicted limits from 1000 and 3000 hr of CTA observations (blue solid and blue dashed). These limits are compared with the predicted fluxes for models of the Geminga (black solid) and Monogem (red solid) pulsars which correctly explain the positron excess observed by AMS-02. We note that limits from the Fermi-LAT are technically set based on a minimum energy E, rather than a traditional E dN/ dE, a difference which is less important given the steeply falling e ± flux.
Other Images in This Article
Copyright and Terms & Conditions
© 2013. The American Astronomical Society. All rights reserved.