Image Details
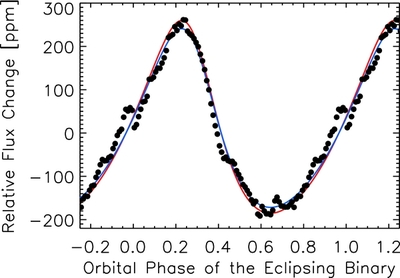
Caption: Figure 8.
Doppler boosting of KIC 4862625. The relative, normalized flux change (see text) is plotted with respect to the EB's orbital phase. The data binned in 0.01 intervals of phase (filled circles) approximately match the flux change estimated from Doppler boosting (red curve) based upon the spectrum of the primary star and its spectroscopically determined radial velocity curve. The amplitude of the best-fitting curve (blue) is 93% ± 1.7% that of the estimate (red).
Other Images in This Article


Show More
Copyright and Terms & Conditions
© 2013. The American Astronomical Society. All rights reserved.
Copyright ©
2025 Astronomy Image Explorer. All Rights Reserved.