Image Details
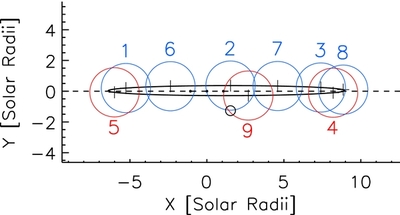
Caption: Figure 10.
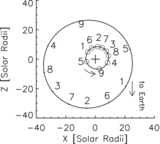
Schematic scale diagram of KIC 4862625. The diagram is to scale, with solar radii indicated on the axes. The positions of star A in its orbit (large circles) are plotted at the times of the nine planetary transits (labeled, large circles centered on black + symbols). Red color indicates the position of the primary star on the near side of its orbit and blue color on the far side. Star B is shown to scale (small circle, arbitrarily positioned below star A at event 2). The planet also is shown to scale (smallest circles); the outer two corresponding to positions −0.25 days and +0.25 days with respect to the center position, which has been arbitrarily centered at the origin.
Other Images in This Article


Show More
Copyright and Terms & Conditions
© 2013. The American Astronomical Society. All rights reserved.