Image Details
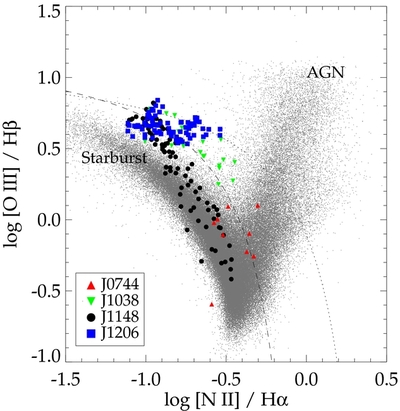
Caption: Figure 4.
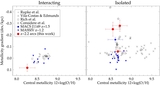
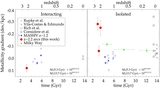
Diagnostic diagram of [N ii]/Hα and [O iii]/Hβ. Each large point represents a single spatial pixel of OSIRIS, and the small
grey points are ~122,000 galaxies from the Sloan Digital Sky Survey (SDSS) with signal to noise ⩾5 in all relevant emission
lines. SDSS galaxies show a locus of star-forming galaxies, and a separate branch of AGNs extending to the upper right. The
dotted line shows the theoretical maximum [O iii]/Hβ from star forming regions (Kewley et al. 2001), and the dashed line is
an empirical division between star-forming galaxies and AGNs from Kauffmann et al. (2003). All regions of the lensed galaxies
are consistent with pure star formation, although [O iii]/Hβ is typically above the locus of SDSS star-forming galaxies at
z
![]() 0. This is commonly observed at high redshift and is attributed to a high ionization parameter (e.g., Hainline et al. 2009;
Erb et al. 2010).
0. This is commonly observed at high redshift and is attributed to a high ionization parameter (e.g., Hainline et al. 2009;
Erb et al. 2010).
Other Images in This Article
Show More
Copyright and Terms & Conditions
© 2013. The American Astronomical Society. All rights reserved.