Image Details
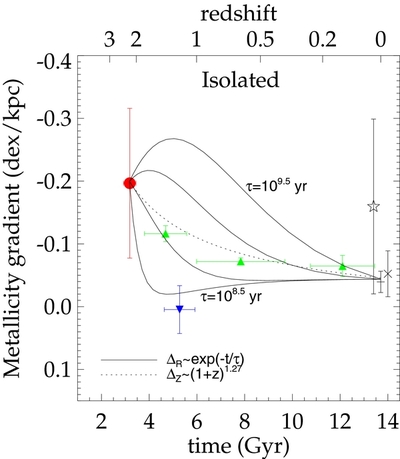
Caption: Figure 10.
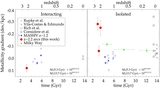
Equivalent to the right panel of Figure 9, showing the mean values of each sample. Error bars denote the 1σ dispersion within each sample. The dotted line shows how gradients will evolve with time if the range of metallicity remains constant while the characteristic radius grows as R∝(1 + z) −1.27 as determined by van Dokkum et al. (2010), scaled to match the lensed galaxies at z = 2.2. The solid lines show evolutionary tracks of the metallicity gradient for an exponentially declining gradient in the effective mass loading factor, as described in Section 5.2. The four lines correspond to timescales τ = 10 8.5, 10 9.0, 10 9.3, and 10 9.5 yr.
Other Images in This Article
Show More
Copyright and Terms & Conditions
© 2013. The American Astronomical Society. All rights reserved.