Image Details
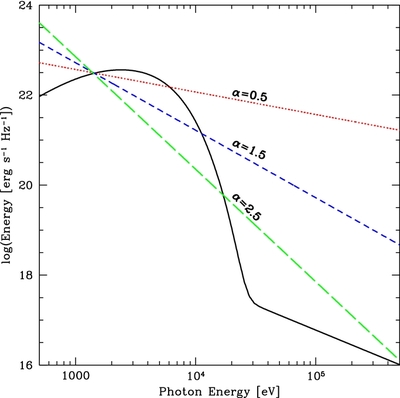
Caption: Figure 4.
Comparison of the composite (i.e., blackbody plus power-law) HMXB spectral energy distribution (solid curve) and possible power-law alternatives (with indices α = 0.5, 1.5, 2.5, corresponding to dotted, short-dashed, and long-dashed curves, respectively). The composite HMXB spectrum is as measured at t = 50 Myr in Figure 1, while the power-law spectra are normalized such that the total energy emitted between 1 and 2 keV is the same for both the composite and power-law spectra.
Other Images in This Article

Copyright and Terms & Conditions
© 2013. The American Astronomical Society. All rights reserved.
Copyright ©
2025 Astronomy Image Explorer. All Rights Reserved.