Image Details
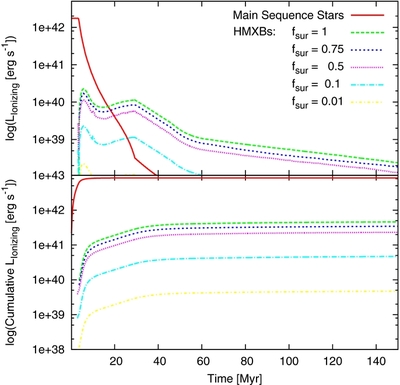
Caption: Figure 2.
Time evolution of the instantaneous and cumulative ionizing power of a stellar population of N = 10 6 stars and a Kroupa IMF (upper and lower panels, respectively). Solid curves correspond to the contribution from MS stars only; curves of different line types correspond to the combined contribution of MS stars and HMXBs for five different values of the survival fraction f sur with 0.01 ⩽ f sur ⩽ 1.
Other Images in This Article

Copyright and Terms & Conditions
© 2013. The American Astronomical Society. All rights reserved.
Copyright ©
2025 Astronomy Image Explorer. All Rights Reserved.