Image Details
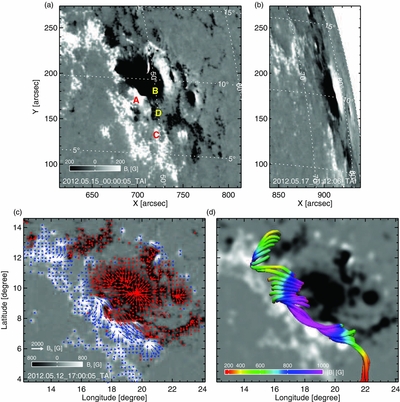
Caption: Figure 6.
(a) HMI line-of-sight (LOS) magnetogram of AR 11476 taken at 00:00 on May 15, about two days before the event. The sunspot with negative polarity is near the image center. (b) HMI LOS magnetogram taken at 01:12 UT on May 17. Both images are scaled between 250 G. (c) HMI vector magnetogram (shown in plate-Carrée projection) of AR 11476 at 17:00 on May 12 when the AR was near the disk center. The horizontal field (shown as the arrows) is superimposed on a background of radial field which is scaled between 800 G. The length of the arrow represents the strength. The color of the arrow (blue/red) indicates the sign (positive/negative) of the radial field. (d) Reconstructed coronal field using a nonlinear force-free (NLFF) model.
Other Images in This Article
Copyright and Terms & Conditions
© 2013. The American Astronomical Society. All rights reserved.