Image Details
Caption: Figure 2.
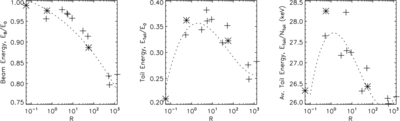
Total energy of beam (left) and tail (middle) electrons, both normalized to the initial beam energy
E
0, and the average energy of a tail electron (right), all evaluated at
t = 100τ
ql, against the parameter
R = τ
D
/τ
ql, which gives a measure of the degree of inhomogeneity. Beam and plasma parameters, and ranges for
 and
v
0 are as given in the text. The asterisks mark the three levels of inhomogeneity shown in Figure
1. The dashed lines are polynomial fits to the data to illustrate its general trends.
and
v
0 are as given in the text. The asterisks mark the three levels of inhomogeneity shown in Figure
1. The dashed lines are polynomial fits to the data to illustrate its general trends.
Other Images in This Article
Copyright and Terms & Conditions
© 2012. The American Astronomical Society. All rights reserved.