Image Details
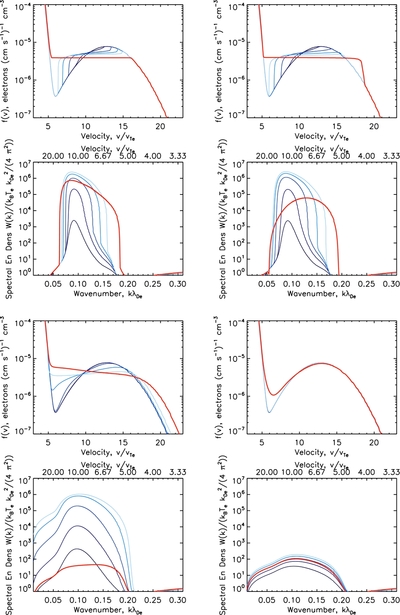
Caption: Figure 1.
Electron distribution
f(
v) (upper plots), and Langmuir wave spectral energy density
W(
k) (lower plots) for homogeneous (top left) and inhomogeneous plasma, with
q
0 = 10
−4
k
de
,
v
0/
v
Te
= 0.3 and
 of 3.7 × 10
−4 (top right), 3.7 × 10
−3 (bottom left), and 1.2 × 10
−2 (bottom right). Lines from dark (blue in online version) to light show the beam relaxation during the first 10 quasilinear
times, while the thick line (red in online version) shows the state reached at
t = 100τ
ql.
of 3.7 × 10
−4 (top right), 3.7 × 10
−3 (bottom left), and 1.2 × 10
−2 (bottom right). Lines from dark (blue in online version) to light show the beam relaxation during the first 10 quasilinear
times, while the thick line (red in online version) shows the state reached at
t = 100τ
ql.
Other Images in This Article
Copyright and Terms & Conditions
© 2012. The American Astronomical Society. All rights reserved.