Image Details
Caption: Figure 2.
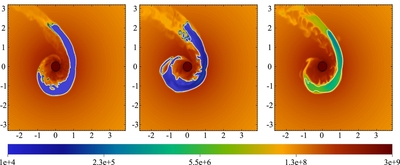
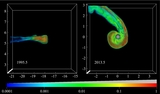
Pseudo-color plots of temperatures for models cc_i1_b1_95, cc_i53_b1_95, and cc_p53_b1_95 on date 2013.5. These plots are
two-dimensional slices in the
z = 0 plane. The black circle indicates the accretion radius,
r
acc = 750
R
S
, while the white contour indicates a cloud tracer level of
 .
.
Other Images in This Article
Copyright and Terms & Conditions
© 2012. The American Astronomical Society. All rights reserved.
Copyright ©
2025 Astronomy Image Explorer. All Rights Reserved.