Image Details
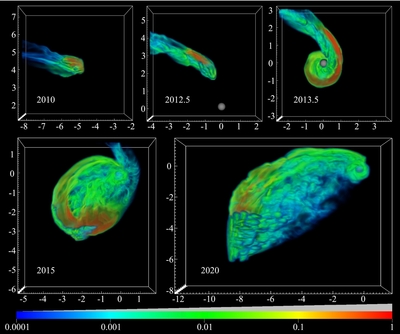
Caption: Figure 1.
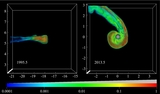
Three-dimensional, volume visualization of cloud tracer material
 for model cc_i1_b1_95, spanning the period 2010–2020. The small gray sphere appearing in each panel beginning in 2012.5 indicates
the accretion volume,
r <
r
acc = 750
R
S
. The color represents the amount of tracer (value of
for model cc_i1_b1_95, spanning the period 2010–2020. The small gray sphere appearing in each panel beginning in 2012.5 indicates
the accretion volume,
r <
r
acc = 750
R
S
. The color represents the amount of tracer (value of
 ) in a particular region, with the transparency also dependent upon the value of
 (as indicated by the slanted gray bar above the color bar). The cloud material initially has a uniform value of
 .
.
(An animation of this figure is available in the online journal.)
Other Images in This Article
Copyright and Terms & Conditions
© 2012. The American Astronomical Society. All rights reserved.