Image Details
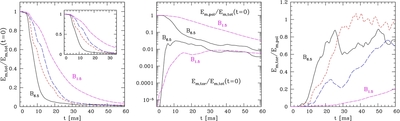
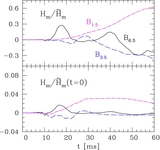
Caption: Figure 3.
Left: evolution of total magnetic energy normalized to the initial value, for different initial magnetic-field strengths: B 6.5 (continuous black line), B 5.0 (dashed red line), B 3.5 (long-dashed blue line), and B 1.5 (dot-dashed magenta line). Middle: evolution of poloidal and toroidal magnetic energies normalized to the initial total magnetic energy (log scale) for B 6.5, B 1.5. Right: ratio of toroidal and poloidal magnetic energies vs. time for the same collection of simulations shown in the left panel.
Other Images in This Article


Copyright and Terms & Conditions
© 2012. The American Astronomical Society. All rights reserved.
Copyright ©
2025 Astronomy Image Explorer. All Rights Reserved.