Image Details

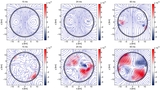
Caption: Figure 2.
Poloidal-field instability in our fiducial simulation with B p = B 6.5. Panels show different stages of the evolution (from left to right t = 3.5, 7.5, and 60 ms) with meridional view (top row) and equatorial view (bottom row). Shown with vector lines are the (global) magnetic-field lines, while the colors show the intensity (in Gauss) of the toroidal magnetic field only; also reported are three rest-mass isodensity contours near the stellar surface, corresponding to ρ = (0.02, 0.2, 2) × 10 13 g cm −3.
Other Images in This Article


Copyright and Terms & Conditions
© 2012. The American Astronomical Society. All rights reserved.
Copyright ©
2025 Astronomy Image Explorer. All Rights Reserved.