Image Details
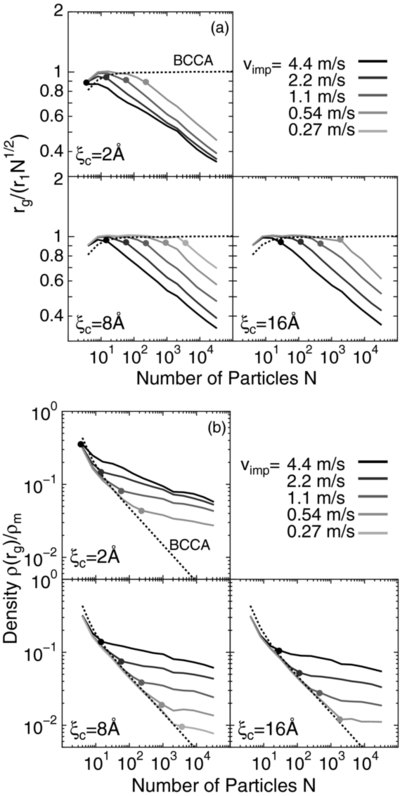
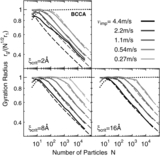
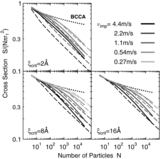
Caption: Figure 2.
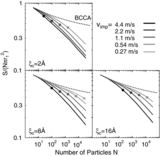
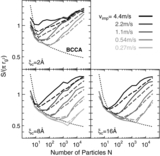
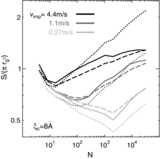
Structure evolution of growing aggregates in the sequential collision simulations for various impact velocities v imp and critical rolling displacements ξ crit. Panel (a) shows the radius of gyration and panel (b) shows the density. The solid lines show the resultant aggregates in our simulations, and the dashed lines indicate BCCA clusters. Filled circles indicate the critical number of particles N crit to start compression, as estimated from Equation (6) with β = 0.5.
Other Images in This Article
Show More
Copyright and Terms & Conditions
© 2012. The American Astronomical Society. All rights reserved.
Copyright ©
2025 Astronomy Image Explorer. All Rights Reserved.