Image Details
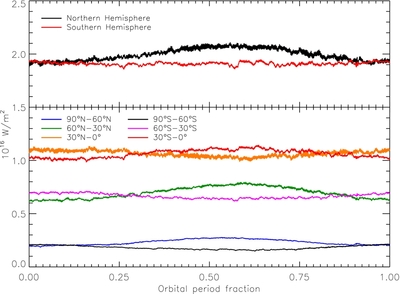
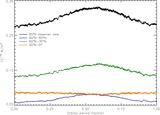
Caption: Figure 7.
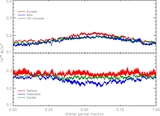
TOA–LW infrared emission flux of the Northern and Southern Hemispheres. Total emission (top) of the Northern Hemisphere (black) and Southern Hemisphere (red). Latitude bands (bottom) of 90°N–60°N (blue), 60°N–30°N (green), 30°N–0° (orange), 90°S–60°S (black), 60°S–30°S (magenta), and 30°S–0° (red).
Other Images in This Article
Copyright and Terms & Conditions
© 2012. The American Astronomical Society. All rights reserved.
Copyright ©
2025 Astronomy Image Explorer. All Rights Reserved.