Image Details
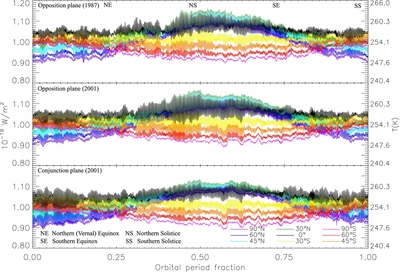
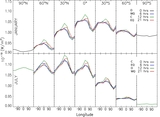
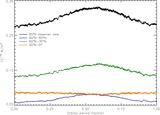
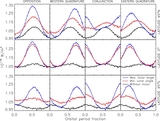
Caption: Figure 3.
Time series of the mid-infrared emission flux for the two years of 1987 (top) and 2001 (middle and bottom). The sub-observer's point is represented by the latitudes 90°N, 60°N, 45°N, 30°N, 0°, 30°S, 45°S, 60°S, 90°S, and 0° longitude at the initial time (January 1, 0:00 UT) and the direction planes of opposition (O) (top and middle) and conjunction (C) (bottom).
Other Images in This Article
Copyright and Terms & Conditions
© 2012. The American Astronomical Society. All rights reserved.
Copyright ©
2025 Astronomy Image Explorer. All Rights Reserved.