Image Details
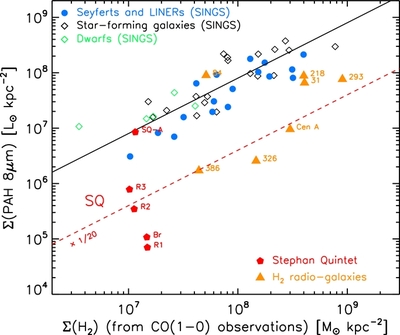
Caption: Figure 5.
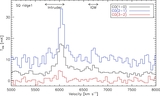
Star formation rate (assumed to be traced by the surface luminosity of the PAH emission) as a function of the surface mass of H 2, derived from CO(1–0) line measurements, integrated over the full velocity range. The solid line shows the relationship obtained for the SINGS sample. Empty diamonds and filled dots mark dwarf galaxies, star-forming galaxies, and AGNs. The SINGS data are from Roussel et al. (2007). The filled red pentagons show the positions within the Stephan's Quintet group where we performed CO observations and extracted IRS spectra. The R1, R2, and R3 are the three positions in the ridge. SQ-A denotes the northern star-forming region and Br denotes the bridge (see Figure 1). For comparison, the orange triangles mark the H 2-luminous radio galaxies of the Ogle et al. (2010) sample for which we have both clear PAH and CO detections.
Other Images in This Article
Copyright and Terms & Conditions
© 2012. The American Astronomical Society. All rights reserved.