Image Details
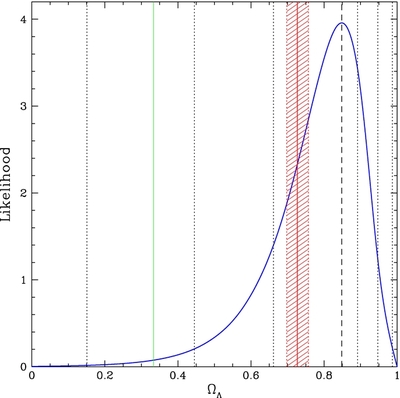
Caption: Figure 5.
Likelihood function for
 with a uniform prior on
r
s
over the range 120–200
h
−1
70 kpc, using the restricted group sample. (The likelihood has been normalized so the area under the curve is 1.) The dashed
vertical line indicates the value
with a uniform prior on
r
s
over the range 120–200
h
−1
70 kpc, using the restricted group sample. (The likelihood has been normalized so the area under the curve is 1.) The dashed
vertical line indicates the value
 where the likelihood peaks. Dotted vertical lines indicate 68.2%, 95.4%, and 99.7% (1σ, 2σ, 3σ) confidence regions. The solid
vertical line and shading indicate the mean
WMAP seven-year value
where the likelihood peaks. Dotted vertical lines indicate 68.2%, 95.4%, and 99.7% (1σ, 2σ, 3σ) confidence regions. The solid
vertical line and shading indicate the mean
WMAP seven-year value
 and 68% confidence range from Larson et al. (2011). The vertical green line indicates the value
 , the lower limit for cosmic acceleration (
q
0 < 0).
, the lower limit for cosmic acceleration (
q
0 < 0).
Other Images in This Article
Copyright and Terms & Conditions
© 2012. The American Astronomical Society. All rights reserved.