Image Details
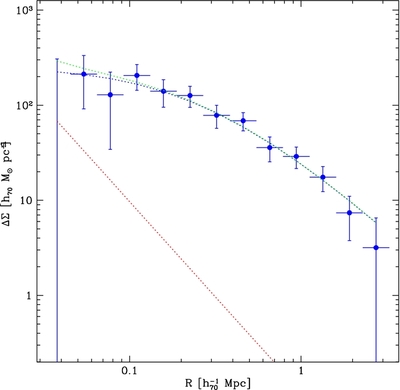
Caption: Figure 2.
Surface mass density contrast as a function of projected physical separation, stacking all groups with well-defined redshifts and centers (the "restricted" sample). The thin dotted lines indicate contributions from a projected NFW profile (middle blue curve), the average stellar mass of the central galaxy in the group (lower red line), and the sum of these two components (upper green curve).
Other Images in This Article
Copyright and Terms & Conditions
© 2012. The American Astronomical Society. All rights reserved.
Copyright ©
2025 Astronomy Image Explorer. All Rights Reserved.