Image Details
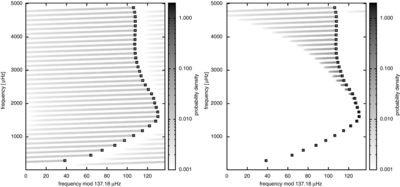
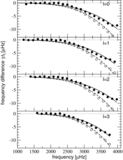
Caption: Figure 3.
Behavior of the beta prior for systematic offsets in an echelle diagram. The squares represent model frequencies, while the shaded "trails" indicate the prior probability density for varying Δ i . The left panel uses equal Δ max, whereas the right panel uses a power-law Δ max with exponent b = 4.9 (see Section 4.1). Note that the uniform prior is not shown, since it simply assigns a constant probability density.
Other Images in This Article
Copyright and Terms & Conditions
© 2012. The American Astronomical Society. All rights reserved.
Copyright ©
2025 Astronomy Image Explorer. All Rights Reserved.