

Image Details
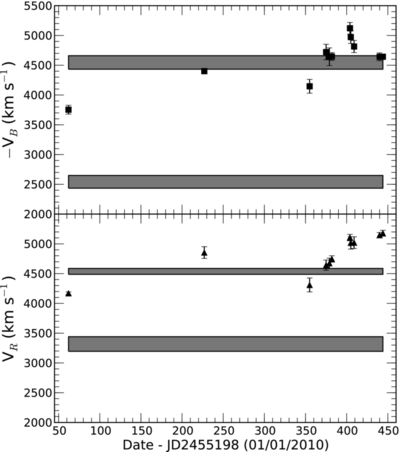
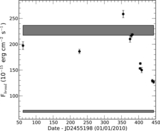
Caption: Figure 4.
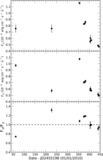
Evolution of the peak velocities of the blue (top panel) and red (bottom panel) peaks from 2010 March to 2011 March. The gray horizontal bars show the minimum and maximum values (plus uncertainties) in the spectra from 1991 to 2001 (SB03).
Other Images in This Article
Copyright and Terms & Conditions
© 2012. The American Astronomical Society. All rights reserved.

Copyright ©
2026 Astronomy Image Explorer. All Rights Reserved.
