

Image Details
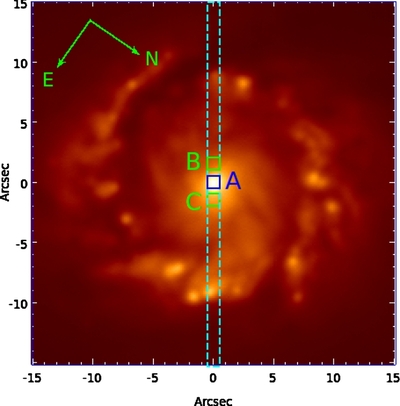
Caption: Figure 1.
Acquisition image from 2010 August 15, where we illustrate the locations of the 1
 0 × 1
0 extraction windows for the nucleus and stellar population spectra. The square labeled A represents the nuclear extraction
window, while squares B and C represent the extranuclear ones, from which we obtained the spectrum of the underlying stellar
population.
0 × 1
0 extraction windows for the nucleus and stellar population spectra. The square labeled A represents the nuclear extraction
window, while squares B and C represent the extranuclear ones, from which we obtained the spectrum of the underlying stellar
population.
Other Images in This Article
Copyright and Terms & Conditions
© 2012. The American Astronomical Society. All rights reserved.

Copyright ©
2026 Astronomy Image Explorer. All Rights Reserved.
